Unit 3 Summary: Constant Acceleration Particle Model
In this unit, I learned about the Constant Acceleration Particle Model (CAPM) I specifically learned how to draw and interpret diagrams to represent the motion of an object traveling, describe the motion of an object in words using the velocity-vs-time graph and solve problems using kinematics concepts.
How are distance and displacement different?
Distance is basically how much ground is covered by an object. Displacement
is just an object's change in position considering its starting position and final
position.
So what exactly is velocity and how does it differ from speed?
Speed just refers to how fast an object is moving. Velocity is
a refers to the rate at which an object
changes its position.
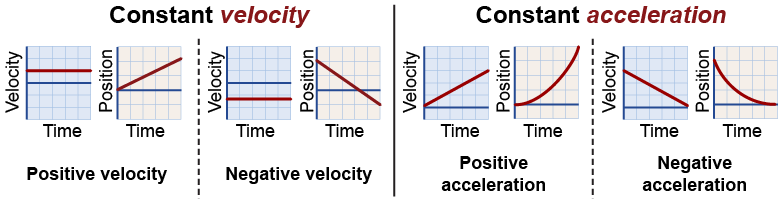
In this unit, graphs are very important tools. Graphs offer a lot of information on an object's motion including velocity and acceleration. I examined three types of graphs throughout this unit: x vs t (position vs time), v vs t (velocity vs time), and a vs t (acceleration vs time). I also used motion maps to represent an object's motion.
 |
In this x vs t graph, the object is traveling at constant velocity in the positive (forward) direction. Constant velocity means that the object in motion is moving in a straight line at a constant speed. This line can be represented as: x = x(o) + vt.
How do you calculate the average velocity?
To calculate the average velocity you must use this formula:

Let's calculate the average velocity of the object's motion represented in the x vs t graph above. We know the object traveled 80 cm in 0.4 seconds.
v = (80 - 0) / (.4 - 0) = 80 / 0.4 = 200 cm/s
Also: If you would like to check your answer you can also calculate the slope to calculate the velocity. The slope of this line would equal 20 cm divided by 0.1 sec or 200 cm/sec.
|
What is instantaneous velocity and how do you calculate it?
Instantaneous velocity is the velocity of an object in motion at a specific point in time. This is determined similarly to average velocity, but we narrow the period of time so that it approaches zero. If an object experiences constant velocity over a period of time, its average and instantaneous velocity may be equal (as in this example).
Let's calculate the instantaneous velocity of the object at 3 seconds. The object had traveled 80 centimeters in 0.4 seconds and 40 centimeters in 0.2 seconds. Just calculate the difference between these two points to find out what the instantaneous velocity is.
Instantaneous v = (80 - 40) / (.4 - .2) = 40 / 0.2 = 200 cm/s
The instantaneous velocity and average velocity are equal in this example due to the object experiencing constant velocity.

This v vs t graph represents the object traveling at constant velocity (200 cm/s).
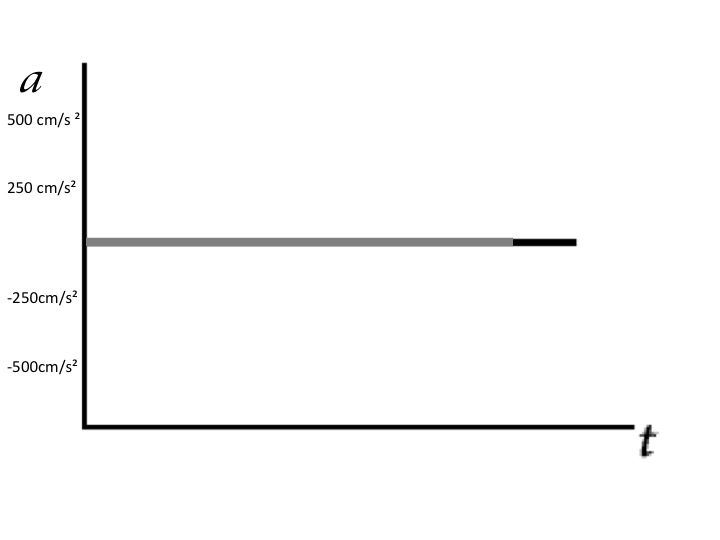
This a vs t graph represents the object experiencing no acceleration at a constant rate. (0 m/s²)

This motion map represent an object traveling at constant velocity.
 |
| The graphs above are v vs t and p vs t graphs. The v vs t graphs represent the object's motion shown in the p vs t graphs. |
Units and Formulas

Acceleration due to Gravity = 9.8 m/s2
Vf - Final Velocity
V0 - Initial Velocity
a - Acceleration
t - Time
Δx - Δ is displacement
x0 - Starting (initial) position
To Calculate Displacement

The shaded area that forms a rectangle represents the object's displacement from 0 seconds to 6 seconds. Displacement can be calculated using the area of a rectangle formula (area = b • h).
Area = b • h
Area = (6 s) • (30 m/s)
Displacement = 180 m
Area = (6 s) • (30 m/s)
Displacement = 180 m

The shaded area that forms a triangle represents the object's displacement from 0 seconds to 4 seconds. Displacement can be calculated
using the area of a triangle formula (area = ½ • b • h).
Area = ½ • b • h
Area = (½) • (4 s) • (40 m/s)
Area = (½) • (4 s) • (40 m/s)
Displacement = 80 m

| The shaded area that forms a trapezoid represents displacement during 2 seconds to 5 seconds. Displacement can be calculated using the area of a trapezoid formula [area = ½ • b • (h1 + h2)].
Area = ½ • b • (h1 + h2)
Area = (½) • (2 s) • (20 m/s + 50 m/s) Displacement = 70 m |
More Graphs and Motion Maps
The motion map below represents a car traveling at constant velocity (5 m/s) in the positive direction for 5 seconds, eventually stopping and remaining at rest (0 m/s) for 5 seconds.
 Now let's graph the motion map's representation of the car's motion!
The graph generated to the right represents the car's motion. As you can see, for the first 5 seconds the slope of the line is positive and increases 5 meters/1 second. The slope of the line equals the velocity of the car. After the car has stopped traveling (last 5 seconds), the slope of the line is 0 (0 m/s) as the car is not traveling.

More Examples

A Ferrari LaFerrari is traveling down the freeway:
Let's say the LaFerrari's acceleration changes by 1 m/s2 every second. This is a constant increase of 1 m/s3. The LaFerrari is increasing its rate of change of velocity each second. The graph to the right represents the LaFerrari's acceleration as it travels down the freeway.

The graph to the left represents an object in which its velocity is changing over time. The velocity is positive and can be calculated using a p vs t graph. (Remember: V = Displacement/Time)
 |
| This p vs t graph represents an object traveling in the negative direction, however it is speeding up as time increases. |
Bibliography
http://hyperphysics.phy-astr.gsu.edu/hbase/mechanics/motgraph.html
http://www.physicsclassroom.com/class/1DKin/Lesson-3/The-Meaning-of-Shape-for-a-p-t-Graph
http://www.hk-phy.org/contextual/mechanics/kin/mo_gr03_e.html
http://formulas.tutorvista.com/physics/kinematics-formulas.html
http://www.bbc.co.uk/bitesize/higher/physics/mech_matt/analyse_motion/revision/1/
https://harmoniaphilosophica.wordpress.com/2013/04/21/physics-constants-not-so-constant/
http://dev.physicslab.org/Document.aspxdoctype=3&filename=Kinematics_VelocityTimeGraphs.xml
|
